05/4/15

The Opioid-Heroin Cycle

© Ouroboros tattoo by Sahua | Stockfresh.com

© Ouroboros tattoo by Sahua | Stockfresh.com

Since the death of Philip Seymour Hoffman on February 2, 2014, there has been a series of calls for the distribution of naloxone or Narcan, which is a prescription medication that reverses an opioid overdose. But it seems that the price of Narcan has doubled over the past year. The Fix and others report that the price of naloxone has recently gone from $51.50 per kit, to nearly $100 per kit. These are the Luer-Jet™ kits sold by Amphastar Pharmaceuticals, the only US company currently selling nasal kits. There is a cheaper injectable form of narcan, but it is supposed to be less user friendly.

Within four days of Hoffman’s death, The New York Times published an article by an emergency physician, noting how greater availability of Naloxone could prevent deaths. He referred to a report in the Annals of Internal Medicine that suggested up to 85 percent of users overdose in the presence of others, providing the opportunity for others to intervene. In Forbes Magazine David Kroll said the CDC reported that naloxone was used in over 10,000 opioid-overdose reversals between 1996 and mid-2010. He also expressed his concerns over potential shortages of naloxone.

Victoria Kim for The Fix reported that Amphastar’s president blamed the price increase of their naloxone product on “steadily increasing” manufacturing costs. But Matt Curtis, the policy director for a New York advocacy group said there had been a fairly steady price for several years. “Then these big government programs come in and now all of a sudden we’re seeing a big price spike. . . . The timing is pretty noticeable.” The Hill reported that Senator Bernie Sanders and Representative Elijah Cummings sent a letter to Amphastar complaining about the price increase and how it is “an obstacle in efforts by police departments to equip officers with the drug.”

Areille Pardes of Vice said that after the CDC said there was an opioid epidemic in 2008, the manufacturer of naloxone, Hospira, increased the price of a dose of naloxone from $3 to a little more than $30. Pardes also reported that the supposed difficulty of a lay-friendly delivery system has also been used to justify the high costs of epipens (around $400) and the naloxone auto-injector, EVIZO (Over $600 for a kit of 2 auto-injectors at Walmart, Sams Club, Target and other retail outlets). However a study found few differences between trained and untrained overdose rescuers in their abilities to use the syringes in a naloxone rescue kit. “Anyone with common sense could figure it out, even without training.”

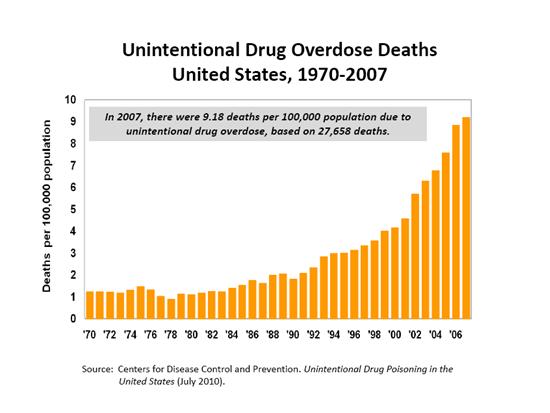
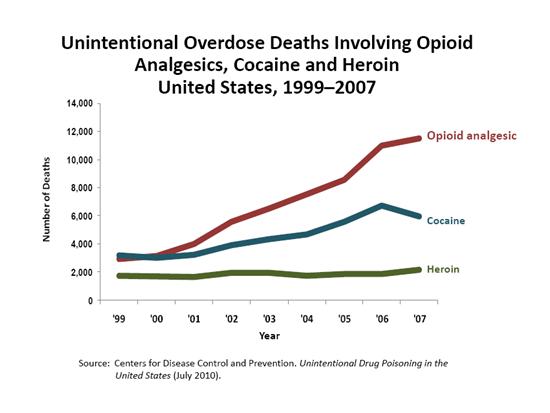
It does seem that the timing of the price increases for naloxone (a generic drug) and its delivery systems occurred just as the epidemic of overdoses took place. The CDC reported in a March 2015 NCHS Data Brief that from 2000 to 2013 the rate of drug overdoses quadrupled, from .7 deaths per 100,000 to 2.7 deaths per 100,000. Overdoses are now the number one cause of injury-related death in the US. While the overdose deaths involving (prescription) opioid analgesics have leveled off in recent years, those from heroin have almost tripled. See Figure 1 of the NCHS Data Brief. While the heroin overdose rates increased among all age brackets, the highest rate of increase was among 25-44 year olds. Geographically, while there were increases in all regions of the country, the greatest increase took place in the Northeast and the Midwest. See figure 5 of the NCHS Data Brief.

There is some sense that effort to curb problems with overprescribing pain medications has inadvertently led to a boom in the misuse of heroin. Richard Juman reported for The Fix that while some treatment providers suggest that is the case, others note that there is evidence that heroin use was increasing before any state or federal interventions with prescribed opioids were implemented. According to Andrew Kolodny, MD:

The idea that efforts to curb prescription drug misuse have led to a spike in heroin use or overdose has become a common media narrative, but the facts don’t support it. It is the overprescribing of opioids itself that has caused increases in opioid addiction of all kinds, not the efforts to control the prescribing. The transition from prescribed opioids to heroin has been happening since the beginning of the epidemic, and there is no evidence that the interventions brought forth to reduce the overprescribing have been fueling the increase in heroin use or overdoses. Because of the epidemic of opioid addiction, you now have markets for heroin that you didn’t have in the past. So there has been an increase in heroin overdose deaths, but that increase was prior to states’ implementation of Prescription Monitoring Programs or any of the changes from the FDA.

I tend to agree with Dr. Kolodny’s assessment. There is a price factor in the shift for many opioid users switching to heroin. And there has been a global market increase in heroin production that paralleled the rise of prescription opioid use. Increased heroin use in the US is market driven. What does seem to be related to increased heroin availability in the US is the diversification of Mexican drug cartels into growing opium poppies, as their market for marijuana dries up. See “The Economics of Heroin.”

There is something very wrong with the cycle of Pharma marketing for increased use of opioids, leading to overprescribing opioids, leading to increased heroin use and increased overdoses, leading to an increased need for narcan, leading back to increased profits with drug companies, where the cycle began. The ouroboros pictured above is a symbol in Greek mythology of a dragon eating its own tail. It symbolizes something that constantly re-creates itself, which seems to be happening here with the opioid-heroin cycle.

04/27/15

Quantifying Impaired Drivers

19447830_sThe CDC statistics on alcohol-impaired driving are stunning. Every day almost 30 people die in the US in motor vehicle accidents. That’s about one person every 51 minutes. In 2012, 10,322 people died in alcohol-impaired accidents, 31% of all traffic-related deaths in the US. Looking at the most at risk drivers with BAC levels of 0.08 or higher involved in fatal crashes in 2012, 32% were between 21 and 24; 27% were between 25 and 34; 24% were between 35 and 44. Half of the children under the age of 14 killed in alcohol-impaired driving accidents were riding in the vehicle with the alcohol-impaired driver.

Two new studies on impaired driving were released by the National Highway Traffic Safety Administration (NHTSA). The Roadside Survey of Alcohol and Drug Use by Drivers (RSADU) found that since 2007, the last time the survey was done, the number of drivers with alcohol in their system declined by about 30 percent. Since the first survey in 1973, alcohol use among survey participants has decreased by almost 80 percent.  In 2014, about 8.3 percent had some measurable amount of alcohol in their system; 1.5 percent of weekend nighttime drivers were .08 or higher on breathalyzer tests. You can download copies of the two surveys and summaries of the results at the above link.

Figure 1 of the report showed a decline in each of three breath alcohol concentration (BrAC) categories since 1973. Individuals who tested at .08 and above, the legal limit in all states, dropped from 7.5 percent in 1973 to 1.5 percent in 2013-2014. This was an 80 percent drop in the percentage of alcohol-impaired drivers on the road on weekend nights. Results, which are no surprise, show that more people are driving with alcohol in their system on weekend nights (Friday and Saturday) than during the daylight on Fridays. “During weekday daytime hours (Friday), only 1.1 percent of drivers were alcohol positive, while at weekend nighttime hours (Friday and Saturday), 8.3 percent of drivers were alcohol positive.” Weekday drivers above the .08 BrAC level were quite low, at .04 percent. See the chart below taken from the NHTSA report.

BrAC chartNHSTA administrator Mark Rosekind said that the survey results showed how “a focused effort and cooperation among the federal government, states and communities, law enforcement, safety advocates and industry can make an enormous difference.” Nevertheless, there is no victory as long as one person dies in an alcohol-related crash.  He then said that the survey raised questions about drug use and highway safety.

The RSADU survey found that 22.5 percent of weekend nighttime drivers tested positive for some drug in oral fluid and/or blood test. This was almost identical to the Friday daytime rate (22.4 percent). When illegal drugs versus legal medication were distinguished, there was a clear difference. More individuals tested positive for illegal drugs on weekend nighttime than Friday daytime (15.2% versus 12.1%, respectively). There was actually a decrease with legal medications from 10.3% during daylight, to 7.3% on weekend nighttime.

The drug with the largest increase in weekend nighttime use was THC. In 2007, 8.6 percent of weekend nighttime drivers tested positive for THC. In 2013-2014, 12.6 percent of weekend nighttime drivers tested positive for THC; a 48 percent increase. The report noted how changes in state policy on marijuana use, now legal in many states for medical use and a growing number of states for recreational use, may have contributed to the increase in marijuana use by drivers.

Further caution interpreting the survey results is needed because drug presence does not necessarily imply driving impairment. “For many drug substances, drug presence can be detected after impairment that might affect driving has passed.” One example is with marijuana. THC can be detected in blood and urine samples several weeks after heavy users have last used marijuana. So there is some indication that reported percentages of impaired drivers from marijuana were high.

Although the attempt to survey impaired drivers is noble and needed, I’m not sure I am all that encouraged by the reported drop in the percentages of alcohol-impaired drivers. Neither am I alarmed at the reported increase with THC positive drivers. And here’s why—I believe all the results are under reporting the true percentages. This is simple common sense. The survey was COMPLETELY VOLUNTARY. You cannot assume that individuals who stopped for the survey were a representative sample of all the impaired drivers on the road at that time! Here is a summary of the methodology given within the executive summary of the National Roadside Survey:

The National Roadside Survey collected information from volunteer drivers at 300 research checkpoints across the Nation. The survey methods were reviewed and approved by an Institutional Review Board and all data was completely anonymous. Drivers were free to pass by the research site or pull in to find out details of the survey. A small fee (up to $60) was offered to compensate drivers for their time. About 85 percent of drivers who pulled into the research site chose to provide breath samples, more than 70 percent provided oral fluid, and over 40 percent chose to provide blood samples.

Although 85.2 percent of the eligible drivers who entered the data collection site to get information on the survey participated, how many just passed by? Additionally, only 42.2 percent provided blood samples.

The second survey, the “Drug and Alcohol Crash Risk” study, assessed whether crash-involved drivers in Virginia Beach over a 20-month time period had drugs in their system at the time of the crash. THC was the most frequently used drug, by 7.6 percent of the crash-involved drivers. However, 6.1 percent of the control group drivers also tested positive for THC. Overall, 16 percent of the crash-involved drivers and 14.4 percent of the control drivers tested positive for drugs. When the data looked at illegal versus legal drugs, 10.4 percent of the crash-involved drivers used an illegal drug, while 8.8 percent of the control group used an illegal drug. See the table below taken from the “Drug and Alcohol Crash Risk” study.

illegal legal drugsAgain, should be used when interpreting the results of the survey as indicating impairment. In some cases, “drug presence can be detected for a period of days or weeks after ingestion.”  The discussion indicated its results were consistent with previous research, including the NHTSA’s 2007 Roadside Survey (RSADU). Driver impairment from both alcohol and other drugs is a serious safety concern. However, drugs other than alcohol have a less-certain impact on driving impairment. This is primarily due to the lack of reliable research into quantifying the driving impairment of substances other than alcohol.

Understanding the effects of other drugs on driving is considerably more complicated than is the case for alcohol impairment. This stems from the fact that there are many potentially impairing drugs and the relationship between dosage levels and driving impairment is complex and uncertain in many cases.

Particularly with the recent legalization of marijuana in several states and the growing acceptance of medical marijuana, more studies into the driving impairment from marijuana need to be done.

09/24/14

The Making of an American Tragedy

image credit: iStock

image credit: iStock

Psychiatrist Peter Breggin said that diagnosing millions of children with ADHD and then treating them with stimulants and other psychoactive chemicals is an American tragedy. “Never before in history has a society attempted to deal with its children by drugging a significant portion of them into conformity while failing to meet their needs in the home, school and society.” According to Dr.Breggin, the ethical scientist and physician, the concerned parent “must feel stricken with grief and dumbfounded” that our society has allowed this to happen to our children.

In October of 2011, the American Academy of Pediatrics (AAP) overrode the FDA and approved diagnosing children as young as four with ADHD and medicating them with Ritalin. The lead author of the report said: “Because of greater awareness about ADHD and better ways of diagnosing and treating this disorder, more children are being helped.” Dr. Breggin said this action was an outrage: “This endorsement of drugging younger children by the American Academy of Pediatrics is an outrage.”

According to Dr. Breggin, the scientific literature shows that 50 percent or more of children this young will become depressed, lethargic, weepy—along with being more manageable when given medications such as Ritalin, Adderall and other ADHD medications. Studies show that stimulants will permanently change brain chemistry in the children, cause shrinkage of brain tissue and predispose them to cocaine addiction in young adulthood. He also feared this endorsement by the AAP would open the door for every other psychiatric drug being prescribed to children that young.

These new guidelines will encourage prescribers to throw caution to the wind with toddlers, opening a Pandora’s box of drug intervention for children. Many young children will have their brains bathed with powerful and often toxic chemicals in the early years of their central nervous system development.

But the problems didn’t stop there. Susanna Visser, who oversees the CDC research on ADHD, presented a report at the Georgia Mental Health Forum in May of 2014 that suggested at least 10,000 2 and 3 year-olds were being medicated for ADHD. “It puts these children and their developing minds at risk, and their health is at risk.” Effective non-drug treatments were often ignored.

Families of toddlers with behavioral problems are coming to the doctor’s office for help, and the help they are getting too often is a prescription for a Class II controlled substance, which has not been established as safe for that young of a child.

As liberal as the AAP guidelines for ADHD are, they do not even address diagnosis in children 3 and younger—let alone the use of stimulant medications—with that age group. Children under 4 are not covered in the guidelines because “hyperactivity and impulsivity are developmentally appropriate for toddlers.” Dr. Lawrence Diller, a pediatrician, said: “People prescribing to 2-year-olds are just winging it. It is outside the standard of care, and they should be subject to malpractice if something goes wrong with a kid.”

Sheila Matthews attempted to put “the insanity of drugging 2-3 year olds” in perspective. She noted that the average weight for male toddlers at three years was 29.5 pounds; female toddlers averaged 28.4 pounds. “By this age, only 80 percent of the child’s brain has fully developed.” Kids at this age are learning to arrange things in groups, to put things in size order, remembering what they did yesterday, learning to say please and thank you, and recognizing themselves in the mirror. “In a nutshell, 2-3 year old toddlers are being labeled with an alleged mental illness that is not based in science or medicine and then “treated” with extremely addictive, mind-altering drugs before their brains are even fully formed.”

Psychiatrist Allen Frances said: “Treating babies with stimulants is based on no research, is reckless, and takes no account of the possible harmful long-term effects of bathing baby brains with powerful neurotransmitter drugs.” He hoped that the CDC report would fuel a backlash of parental and professional protest as it becomes clearer how absurdly overused is the ADHD diagnosis and stimulant medication. “It is also particularly outrageous that so many of the thought leaders promoting the excessive use of stimulants have such close ties with pharmaceutical companies.”

Dr Breggin lamented that instead of meeting the normal needs of our children, we are suppressing them with drugs. The average parent or teacher has no idea that what is presented as medical treatment “is actually a form of medical child abuse.” What they see is a more manageable child and assumes this is for the best. Instead, it is the making of an American tragedy.

09/15/14

Homegrown Epidemic

The White House reported that the Centers for Disease Control and Prevention (CDC) identified prescription drug abuse as an epidemic.  The 2012 National Survey on Drug Use and Health (NSDUH) reported that 4.9 million people, 1.9% of the population, abused prescription drugs. Nonmedical use of psychotherapeutics, particularly pain relievers, was the most commonly used illicit substance after marijuana. “In our military, illicit drug use increased from 5% to 12% among active duty service members from 2005 to 2008, primarily due to non-medical use of prescription drugs.” Drug induced deaths have almost doubled since 1999 and are now second only to motor vehicle fatalities.

At the end of 2013, Genetic Engineering & Biotechnology News (GEN) published a list of the top 17 abused drugs of 2013. The table below combines most of the given statistical information in the list of abused drugs and presented them in rank order, from one to seventeen.

There is no surprise that seven of the listed drugs are either prescribed for some kind of “pain” condition or are opioids (OxyContin, Suboxone, Opana, Fentora [fentanyl], Percocet, Soma, Vicodin). Vicodin is now classified as a schedule 2 controlled substance. Soma is now a schedule 3 controlled substance. Suboxone  (schedule 3) is an opioid approved for opioid drug treatment.

Three of the medications are used to treat ADHD (Concerta, Ritalin, Adderall); all three are in the top 8 most abused drugs. Four of the drugs are benzodiazepines (Xanax, Klonopin, Ativan, Valium; schedule 4).  Two medications are sleep aides (Ambien, Lunesta). One, Zoloft, is an SSRI used to treat depression.

Drug

Rank

2012 Sales

2011 Sales

Patent

Use

OxyContin

1

2.7 billion

2.8 billion

until 2025

pain

Suboxone

2

1.4 billion

1.2 billion

until 2020

mainten

Concerta

3

1.1 billion

1.3 billion

invalid

ADHD

Ambien CR

4

671 million

661 million

until 2020

sleep

Ritalin

5

554 million

550 million

expired

ADHD

Zoloft

6

541 million

573 million

expired

depression

Lunesta

7

447 million

420 million

until 2014

sleep

Adderall XR

8

429 million

533 million

expired

ADHD

Opana

9

299 million

384 million

until 2025

pain

Xanax

10

274 million

308 million

expired

anxiety

Klonopin

11

194 million

211 million

expired

anxiety

Fentara

12

161 million

186 million

until 2019

pain

Percocet

13

103 million

104 million

expired

pain

Ativan

14

30 million

25 million

expired

anxiety

Soma

15

27 million

46 million

expired 1/12

pain

Valium

16

8 million

11 million

expired

anxiety

Vicodin

17

N/A

168 million

expired

pain

Suboxone is likely on the list because of its use by opioid abusers and addicts as a “back up” to forestall withdrawal when the opioids aren’t available. However, along with other opioids it can be combined with benzodiazepines for a heroin-like euphoria. The combination of these two classes of drugs has increasingly become one of the signatures of accidental overdose deaths worldwide. The 2012 NSDUH reported that 4.8% of the population over the age of 12 had used pail relievers illicitly within 30 days of being surveyed.

In their own right, benzodiazepines have a long history of abuse. Valium was the best selling drug in the Western world from 1968 to 1981. It wasn’t until 1975 that the U.S. Justice Department required that benzodiazepines be listed as schedule 4 drugs under the Controlled Substances Act. As Robert Whitaker noted: “This designation limited the number of refills a patient could obtain without a new prescription, and revealed to the public that the government had concluded that benzodiazepines were, in fact, addictive.” The 2012 NSDUH reported that 2.3% of the population over the age of 12 had used tranquilizers illicitly within 30 days of being surveyed.

Attention-deficit disorder did not appear as a “disease” in the Diagnostic and statistical Manual until 1980. In 2007, the CDC reported that one in every twenty-three American children between the ages of four and seventeen is taking an ADHD medication. Concerta, Ritalin and Adderall are all schedule II controlled substances; classified to be as potentially addictive as OxyContin, Opana, Fentara, Percocet, and Vicodin. Concerta and Ritalin are the brand names for the generic drug, methylphenidate.  The 2012 NSDUH reported that 1.3% of the population over the age of 12 had used stimulants illicitly within 30 days of being surveyed.

The medications on the GEN list of abused drugs include some of the most commonly prescribed classes around: drugs for pain relief, anxiety, ADHD, and sleep problems.  The Daily Beast reported that: “The US, which holds 5 percent of the world’s population, is responsible for 75 percent of global prescription drug use.” So the chances that at some time in your life you will be prescribed one of these 17 drugs for a legitimate medical reason is high. Be careful in how you use them and most especially, how long you use them.

 
08/20/14

Suicide is NOT Painless

iStock_000030427100Small

image credit: iStock

Recently we all heard of the successful suicide of Robin Williams. The media aftermath has stirred up a shit-storm of debate and controversy. I asked someone who lost a loved one to a completed suicide how they reacted to the news. The person’s hope was that since Robin Williams was a celebrity, that a constructive dialogue would occur and help someone else decide not to try suicide. So I want to introduce you to some suicide statistics that relate directly to the tragic loss of Robin Williams. And perhaps start us thinking about how we can help prevent other people from trying to end their life.

The Center for Disease Control and Prevention (CDC) maintains a wealth of statistics on suicide at “National Suicide Statistics at a Glance.”  Among the trends in suicide rates for males between the age of 45 and 64, suicide by firearms were most common, 15.52 per 100,000 in 2009. Suicide by suffocation was second. “Suffocation suicide rates among males aged 45 to 64 years have increased 103.5% since 2001 from 2.91 to 5.92 suicides per 100,000 in 2009.”

“From 1991 to 2009 the suicide rates were consistently higher among males 65 years and older compared to the younger age groups.” But they were decreasing, from 40.12 per 100,00 in 1991 to 29.09 in 2009. HOWEVER, the rates of males between 25 and 64 increased from 21.27 per 100,000 in 2000, to 25.37 per 100,000 in 2009.

I then looked at the latest census figures available on the US census website for males between the ages of 25 and 64 to estimate the number of males these suicide statistics would reflect. Roughly 2,000 men like Robin Williams between the ages of 25 and 64 successfully completed suicide—480 who did so by suffocation—in 2009, the last year statistics were available. So there were 479 other families who suffered the pain of a completed suicide, as does the family of Robin Williams.

What can you do to help prevent more suicides? Look at the website for the National Strategy for Suicide Prevention  (NSSP) for information. The NSSP has a number of goals and objectives to facilitate suicide prevention:

  • Foster positive public dialogue; counter shame, prejudice, and silence; and build public support for suicide prevention;
  • Address the needs of vulnerable groups, be tailored to the cultural and situational contexts in which they are offered, and seek to eliminate disparities;
  • Be coordinated and integrated with existing efforts addressing health and behavioral health and ensure continuity of care;
  • Promote changes in systems, policies, and environments that will support and facilitate the prevention of suicide and related problems;
  • Bring together public health and behavioral health;
  • Promote efforts to reduce access to lethal means among individuals with identified suicide risks;
  • Apply the most up-to-date knowledge base for suicide prevention.

From the revised NSSP, the Action Alliance selected four priorities in suicide prevention that, if accomplished, they hope will help the group reach its goal of saving 20,000 lives in the next five years. These priorities are:

  1. Integrate suicide prevention into health care reform and encourage the adoption of similar measures in the private sector.
  2. Transform health care systems to significantly reduce suicide.
  3. Change the public conversation around suicide and suicide prevention.
  4. Increase the quality, timeliness, and usefulness of surveillance data regarding suicidal behaviors.

One agency I worked for required counselors to complete the background paperwork and have the necessary forms signed during the initial session with a new client NO MATTER WHAT. In a way that was understandable, because if the person never returned and you didn’t have the right forms signed, the agency wouldn’t get paid for the time you spent with the individual. But it made it difficult for the counselor if someone was in crisis, or needed some encouragement. One time I broke that rule and inadvertently helped prevent a suicide.

The more information and forms I completed, the greater was my impression that the woman was discouraged and hopeless. So I stopped the paper pushing and really talked with her about her problems. She had struggled off and on with drug use for over twenty years and didn’t have much hope at that moment that she could stop and get her life together. Her last relapse had led to the breakup of a long-term relationship. We talked and I was able to help her see she could re-establish abstinence; maybe even reconcile the relationship. There was some hope.

When she returned for the second appointment we completed the required paperwork that I didn’t do during the first session. And then she told me she had decided before our first counseling session that if she felt as hopeless after the session as she did before it, she had intended to kill herself. People will sometimes say that they intended to kill themselves, but not really have more than the idea of suicide. But she has a prior history of attempts; and she had a plan that would have been successful if she attempted it.

We have a responsibility to be with one another, to make space for one another, to be kind to one another… and hopefully through doing so, we make life that much more bearable. We do our best suicide prevention by letting go of the goal of suicide prevention, and, instead, creating alternatives.

I think this quote’s essay is headed in the right direction for suicide prevention. Maybe the best technique is to simply be committed to letting people know that you care enough about them to enter their darkness and help them move out into some light.

 
07/30/14

Getting Off the Antidepressant Merry-Go-Round

I told Allison to concentrate on my voice and imitate how I was breathing. My coworker held her head in her lap. Together we kept Allison focused until the paramedics came. Determined to stop all drug use after she came into outpatient drug and alcohol treatment, she decided to stop taking her Paxil … cold turkey. The result was a severe panic attack and ER visit.

The Center for Disease Control and Prevention (CDC) estimated that eleven percent of Americans 12 and over use antidepressants. More than 60% of those taking an antidepressant medication have taken it for 2 years or longer; 14% have taken the medication for 10 years or more. Like Allison, women between the ages of 40 and 59 are those most likely to be taking an antidepressant (22.8%). Antidepressants were the most commonly used medication by persons aged 18-44; they were the third most commonly used prescription drug by all Americans in 2005-2008.

Okay, you’re thinking you want to try to withdraw from antidepressants; but you don’t want to duplicate Allison’s experience. What should you do?

First, do some research on the growing evidence of problems with antidepressants.

Look at some of the material available on the websites “ToxicPsychiatry” by Peter Breggin and PsychRights by Jim Gottstein. Here are a few recommendations.

Start with Patient Online Report of Selective Serotonin Reuptake Inhibitor-Induced Persistent Postwithdrawal Anxiety and Mood Disorders, by Carlotta Belaise,  Alessia Gatti, Virginie-Anne Chouinard, and Guy Chouinard,on Psychrights. It is a short, easy to read study of online self-reports of withdrawal symptoms and postwithdrawal symptoms that they attributed to the discontinuation of SSRI antidepressants.

Then read “Do Antidepressants Cure or Create Abnormal Brain States?” by Joanna Moncrieff, found on ToxicPsychiatry. If you want further information, try her book, The Myth of the Chemical Cure. Dr. Moncrieff effectively challenges the received wisdom of the chemical imbalance theories underlying the use medications for depression, psychosis and bipolar disorder.

If you have used antidepressants for a number of years, also read: “Now Antidepressant-induced Chronic Depression Has a Name: Tardive Dysphoria,” by Robert Whitaker. Try out his website as well, Mad in America.

You can also read two articles that I’ve written and made available here on Faith Seeking Understanding: “Antidepressant Withdrawal or Discontinuation Syndrome?” and “Antidepressants Their Ineffectiveness and Risks.

Second, become familiar with the potential postwithdrawal side effects of antidepressant withdrawal.

There is a website of free resources at RxISK. You can research reported side effects by drug name; and you can report a drug’s side effects. But be sure to look at the “Symptoms-on-Stopping Zone.” Read about the concept of medication spellbinding coined by Peter Breggin on his ToxicPsychiatry site. Try his article, “Intoxication Anosognosia: The Spellbinding Effect of Psychiatric Drugs” or his book, Medication Madness for a more detailed discussion.

Mario Fava has developed a scale to assess withdrawal/discontinuation symptoms during an antidepressant taper. You can see a copy of his DESS Scale here; and read about antidepressant discontinuation here. You can download the original Fava article here after registering with psychiatrist.com.

Finally, don’t try this at home alone.

Read this blog post on Mad in America by Monica Cassani. Locate psychiatric support groups and websites like Beyond Meds by Monica Cassani. RxISK has published a detailed “Guide to Stopping Antidepressants.” Also read Your Drug May Be Your Problem: How and Why to Stop Taking Psychiatric Medications or Psychiatric Drug Withdrawal, both by Peter Breggin.

Make sure you have medical support and monitoring from a doctor or psychiatrist who is supportive of your attempt to taper. Someone who is president of the local chapter of NAMI and believes in the chemical imbalance theory of depression is not a good choice to supervise your drug taper. Postwithdrawal symptoms will be seen as the re-emergence of your underlying psychiatric disorder and proof you need to be on medications for life.

Tell family and friends of your decision and enlist them (those who are receptive to your decision to taper) as members of an accountability or support group. Have them read this material.

In closing, remember this warning by Dr. Peter Breggin on his website:

Most psychiatric drugs can cause withdrawal reactions, sometimes including life-threatening emotional and physical withdrawal problems. In short, it is not only dangerous to start taking psychiatric drugs, it can also be dangerous to stop them. Withdrawal from psychiatric drugs should be done carefully under experienced clinical supervision.

06/16/14

Killing Us Softly with Prescription Drugs

And now, the top five abused prescription drugs of 2013 are: 1) OxyContin®, 2) Suboxone®, 3) Concerta, 4) Ambien and 5) Ritalin. Rounding out the top ten are: 6) Zoloft, 7) Lunesta, 8) Adderal XR, 9) Opana® ER, and 10) Xanax.  Three of the top ten are prescribed for ADHD; two are prescribed for pain relief; another two are sleep aides. Plus there is a tranquilizer, an antidepressant and AN OPIOID MAINTENANCE DRUG! Don’t get me started about that one (Suboxone; buprenorphine). Well it’s actually too late to say that. See “Is Buprenorphine Just a New Head for the Hydra of Opiate Addiction?”

See a list of the top 17 abused prescription drugs here.

The website from which the information on the top abused prescription drugs was taken, GeneticEngineering & Biotechnology News also took a poll of its readers on whether the government should move to put limits on the availability and use of pain and mood-altering drugs. 52.7% said yes; 47.3% said no. It amazes me that the vote was so evenly split. I would have liked to see a higher percentage of yeses.  Let’s look at some further information on the abuse of prescription drugs and then ask that question again.

For several years, the nonmedical use of prescription drugs has been the second most commonly abused illicit substance after marijuana. The rankings of most frequently abused illicit drugs for 2012 are: marijuana, pain relievers, tranquilizers, cocaine, stimulants, ecstasy, methamphetamine and THEN heroin. See my “2012 National Drug Use Summary” for more information.

Let’s look at some straight up statistics from the Center for Disease Control (CDC). The drug overdose death rate per 100,000 was approximately 1.0 in 1970. By 2007 that rate had risen to 9.18. The following graphic (to the left)  is from the Office of National Drug Control Policy report on “Prescription Drug Abuse.”

There are now more unintentional overdose deaths from opioids than cocaine and heroin COMBINED, as illustrated by the additional graphic, also from the Office of National Drug Control Policy report on “Prescription Drug Abuse.” (to the right)

pd_chart2-lg

pd_chart3_lg


2000

2002

2004

2009

2010

All ages

6.2

8.2

9.4

11.9

12.3

15-24

3.7

5.1

6.6

7.7

8.2

55-64

4.2

6.0

7.8

13.7

15.0

White males

8.4

11.1

12.6

16.4

16.8

White females

4.3

6.2

7.5

10.3

10.9

Black males

10.8

11.5

11.1

10.8

10.1

Black females

4.1

5.0

5.5

5.6

5.7

Further data from the CDC on death rates from opioid analgesics indicates that in the year 2000, the death rate per 100,000 of the US population for all ages was 6.2. By 2010 the rate had increased to 12.3. Among 15-24 year olds, the death rate was 3.7 in 2000 and 8.2 in 2010.  For individuals between the ages of 55 and 64, the death rate was 4.2 in 2000 and 15.0 in 2010. White male death rates have increased from 8.4 in 2000 to 16.8 in 2010; white females from 4.3 in 200 to 10.9 in 2010. Rates for Black or African American males actually fell; Black female rates had a slight increase. See the table above for selected years and demographics. Go to the CDC report for additional information.