 The CDC statistics on alcohol-impaired driving are stunning. Every day almost 30 people die in the US in motor vehicle accidents. That’s about one person every 51 minutes. In 2012, 10,322 people died in alcohol-impaired accidents, 31% of all traffic-related deaths in the US. Looking at the most at risk drivers with BAC levels of 0.08 or higher involved in fatal crashes in 2012, 32% were between 21 and 24; 27% were between 25 and 34; 24% were between 35 and 44. Half of the children under the age of 14 killed in alcohol-impaired driving accidents were riding in the vehicle with the alcohol-impaired driver.
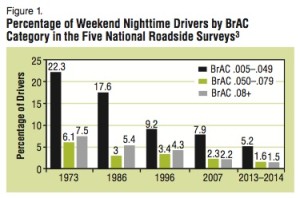
Two new studies on impaired driving were released by the National Highway Traffic Safety Administration (NHTSA). The Roadside Survey of Alcohol and Drug Use by Drivers (RSADU) found that since 2007, the last time the survey was done, the number of drivers with alcohol in their system declined by about 30 percent. Since the first survey in 1973, alcohol use among survey participants has decreased by almost 80 percent. In 2014, about 8.3 percent had some measurable amount of alcohol in their system; 1.5 percent of weekend nighttime drivers were .08 or higher on breathalyzer tests. You can download copies of the two surveys and summaries of the results at the above link.
Figure 1 of the report showed a decline in each of three breath alcohol concentration (BrAC) categories since 1973. Individuals who tested at .08 and above, the legal limit in all states, dropped from 7.5 percent in 1973 to 1.5 percent in 2013-2014. This was an 80 percent drop in the percentage of alcohol-impaired drivers on the road on weekend nights. Results, which are no surprise, show that more people are driving with alcohol in their system on weekend nights (Friday and Saturday) than during the daylight on Fridays. “During weekday daytime hours (Friday), only 1.1 percent of drivers were alcohol positive, while at weekend nighttime hours (Friday and Saturday), 8.3 percent of drivers were alcohol positive.” Weekday drivers above the .08 BrAC level were quite low, at .04 percent. See the chart below taken from the NHTSA report.
 NHSTA administrator Mark Rosekind said that the survey results showed how “a focused effort and cooperation among the federal government, states and communities, law enforcement, safety advocates and industry can make an enormous difference.” Nevertheless, there is no victory as long as one person dies in an alcohol-related crash. He then said that the survey raised questions about drug use and highway safety.
The RSADU survey found that 22.5 percent of weekend nighttime drivers tested positive for some drug in oral fluid and/or blood test. This was almost identical to the Friday daytime rate (22.4 percent). When illegal drugs versus legal medication were distinguished, there was a clear difference. More individuals tested positive for illegal drugs on weekend nighttime than Friday daytime (15.2% versus 12.1%, respectively). There was actually a decrease with legal medications from 10.3% during daylight, to 7.3% on weekend nighttime.
The drug with the largest increase in weekend nighttime use was THC. In 2007, 8.6 percent of weekend nighttime drivers tested positive for THC. In 2013-2014, 12.6 percent of weekend nighttime drivers tested positive for THC; a 48 percent increase. The report noted how changes in state policy on marijuana use, now legal in many states for medical use and a growing number of states for recreational use, may have contributed to the increase in marijuana use by drivers.
Further caution interpreting the survey results is needed because drug presence does not necessarily imply driving impairment. “For many drug substances, drug presence can be detected after impairment that might affect driving has passed.” One example is with marijuana. THC can be detected in blood and urine samples several weeks after heavy users have last used marijuana. So there is some indication that reported percentages of impaired drivers from marijuana were high.
Although the attempt to survey impaired drivers is noble and needed, I’m not sure I am all that encouraged by the reported drop in the percentages of alcohol-impaired drivers. Neither am I alarmed at the reported increase with THC positive drivers. And here’s why—I believe all the results are under reporting the true percentages. This is simple common sense. The survey was COMPLETELY VOLUNTARY. You cannot assume that individuals who stopped for the survey were a representative sample of all the impaired drivers on the road at that time! Here is a summary of the methodology given within the executive summary of the National Roadside Survey:
The National Roadside Survey collected information from volunteer drivers at 300 research checkpoints across the Nation. The survey methods were reviewed and approved by an Institutional Review Board and all data was completely anonymous. Drivers were free to pass by the research site or pull in to find out details of the survey. A small fee (up to $60) was offered to compensate drivers for their time. About 85 percent of drivers who pulled into the research site chose to provide breath samples, more than 70 percent provided oral fluid, and over 40 percent chose to provide blood samples.
Although 85.2 percent of the eligible drivers who entered the data collection site to get information on the survey participated, how many just passed by? Additionally, only 42.2 percent provided blood samples.
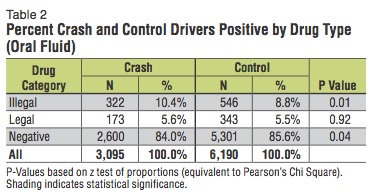
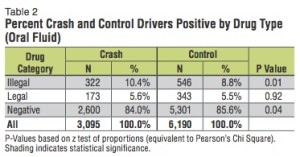
The second survey, the “Drug and Alcohol Crash Risk” study, assessed whether crash-involved drivers in Virginia Beach over a 20-month time period had drugs in their system at the time of the crash. THC was the most frequently used drug, by 7.6 percent of the crash-involved drivers. However, 6.1 percent of the control group drivers also tested positive for THC. Overall, 16 percent of the crash-involved drivers and 14.4 percent of the control drivers tested positive for drugs. When the data looked at illegal versus legal drugs, 10.4 percent of the crash-involved drivers used an illegal drug, while 8.8 percent of the control group used an illegal drug. See the table below taken from the “Drug and Alcohol Crash Risk” study.
 Again, should be used when interpreting the results of the survey as indicating impairment. In some cases, “drug presence can be detected for a period of days or weeks after ingestion.” The discussion indicated its results were consistent with previous research, including the NHTSA’s 2007 Roadside Survey (RSADU). Driver impairment from both alcohol and other drugs is a serious safety concern. However, drugs other than alcohol have a less-certain impact on driving impairment. This is primarily due to the lack of reliable research into quantifying the driving impairment of substances other than alcohol.
Understanding the effects of other drugs on driving is considerably more complicated than is the case for alcohol impairment. This stems from the fact that there are many potentially impairing drugs and the relationship between dosage levels and driving impairment is complex and uncertain in many cases.
Particularly with the recent legalization of marijuana in several states and the growing acceptance of medical marijuana, more studies into the driving impairment from marijuana need to be done.

