Hardwiring Young Brains

© zimagination | 123rf..com
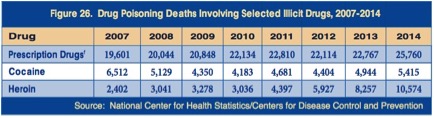
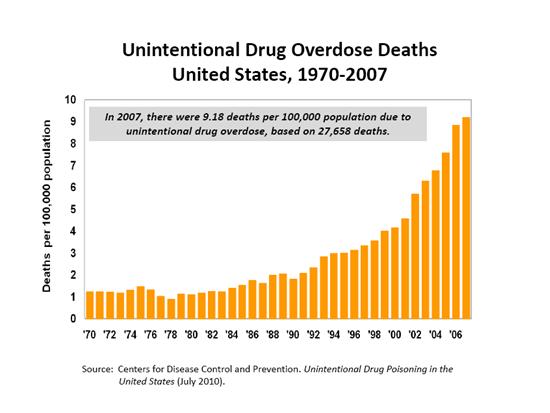
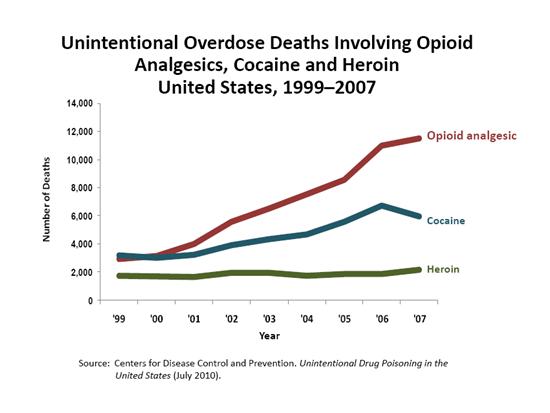
The U.S. Department of Health and Human Services published a report in 2009, “Addressing Prescription Drug Abuse in the United States”, that noted a significant milestone was surpassed with prescription drugs. “For the first time in the U.S., drug overdose deaths outnumbered deaths due to motor vehicle crashes.” In 1999, opioids were involved in 30% of drug overdose deaths. By 2010, this had risen to 60%. Prescription opioid-related overdose deaths then outnumbered overdose deaths from all illicit drugs such as heroin and cocaine.
Opioids are getting the most attention as result of their potential to lead to an overdose, but other classes of psychotherapeutic drugs are also misused. The 2020 National Survey on Drug Use and Health (NSDUH), showed that prescription stimulants, tranquilizers or sedatives such as benzodiazepines are also misused. The 2020 NSDUH defined the misuse of prescription drugs as “use in any way not directed by a doctor, including use without a prescription of one’s own; use in greater amounts, more often, or longer than told to take a drug; or use in any other way not directed by a doctor.” Among people 12 and older 5.8% (16.1 million people) misused prescription psychotherapeutic drugs in 2020.
The 16.1 million people in 2020 who misused prescription psychotherapeutic drugs in the past year included 9.3 million people who misused prescription pain relievers, 6.2 million people who misused prescription tranquilizers or sedatives (including 4.8 million past year misusers of benzodiazepines), and 5.1 million people who misused prescription stimulants.
Surprisingly, the most recent information on the top abused prescription drugs was from 2016 by Statistica and 2017 by GEN, Genetic Engineering & Biotechnology News. GEN listed the top 20 abused drugs ranked by sales data, as did Statistica. The rankings according to revenue are almost identical. Not only have Statistica and GEN failed to continue their monitoring of prescription drugs in this way, I could find no other agency or organization that had done so. I wonder if the pharmaceutical companies had anything to do with this failure.
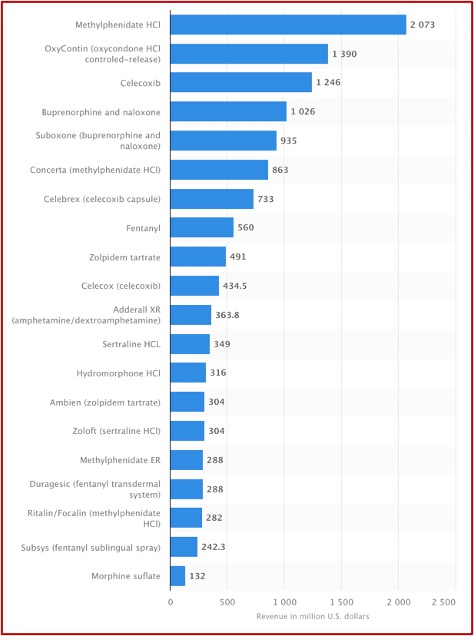
Statistica put their findings in handy chart (see above) but GEN did not. However, there was added information in the GEN article. This included a brief observation that fifteen of the top twenty drugs showed reduced overall sales from the previous year, likely from the lower prices of generics. Gen said that according to GlobalData, sales for ADHD drugs like Adderall and Concerta were projected to more than double by 2024, from $6.1 billion in 2014 to $13.9 billion. See the chart below which is composed of information in the GEN article.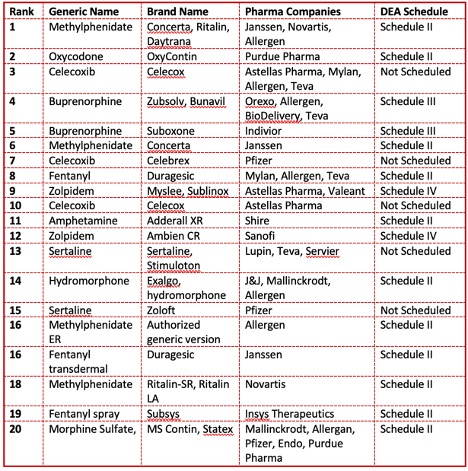 Eight of the listed drugs were opioids. All but five were scheduled as Controlled Substances by the DEA, meaning they have an addictive potential. Methylphenidate, an ADHD stimulant found in Ritalin, Concerta and Daytrana, was in three different drugs on the list as well as the generic drug. Zoloft (sertraline), an antidepressant SSRI, made the list in two different drug forms. Celecoxib, an arthritis treatment, was found in three drugs. Ironically, buprenorphine, one of only three drugs approved for the treatment of opioid misuse, was itself on the list of most abused prescription drugs, with only OxyContin listed ahead of it in pain reliever sales.
Reflecting on the implications of this information for drug treatment, a few questions arise. Are individuals (or parents in the case of ADHD medications) cautioned about the potential for developing an addiction when they or their children are first prescribed any of these drugs? Does the presence of medications like sertraline (Zoloft) and celecoxib on these lists point to a conundrum when they demonstrate a misuse potential but were not listed as controlled substances by the DEA? Does the reality of these medications being abused raise concerns for other medications in the same drug class?
According to ClinCalc, Zoloft was the 12th most prescribed drug, with 7.7 million patients and 37.2 prescriptions. Forbes said it was often a first line medication for depression, anxiety and PTSD. None of the above abused drugs had more total prescriptions. Zoloft and other antidepressants like it are beginning to be viewed as addictive, so we may see more SSRIs on future most abused prescription drug lists. Long-term users seem to go through withdrawal when stopped too abruptly. See “Are Antidepressants Worth the Risk?”
Misuse of Prescription Drugs by Class
Returning to the 2020 NSDUH, the report also gave information on the misuse of prescription stimulants, tranquilizer or sedative misuse, benzodiazepine misuse and pain reliever misuse.
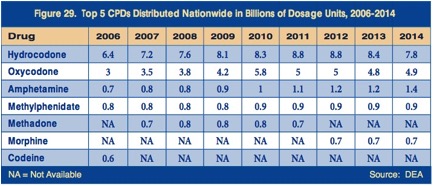
Prescription stimulant misuse included amphetamine (i.e., Adderall XR) and methylphenidate (i.e., Ritalin, Concerta, Daytrana) products. Among people aged 12 and older, 1.8 percent of the population (or 5.1 million people) misused prescription stimulants in the past year. The percentage was highest among young adults aged 18 to 25 at 4.8% (or 1.6 million people). All other age categories hovered between 1 and 2 percent.
For the most part, prescription stimulants to treat ADHD are Schedule II controlled substances. To what extent does their use as the child’s brain develops lead to substance abuse disorders in later years? See the figure below.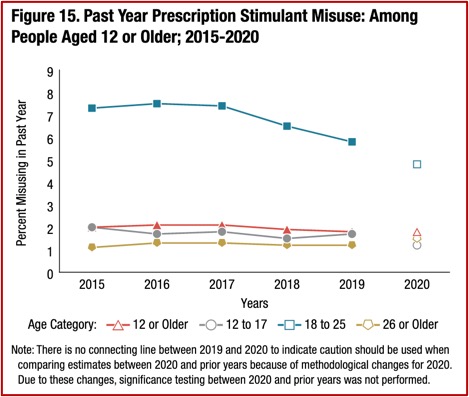
Tranquilizer or sedative misuse included benzodiazepine tranquilizers such as alprazolam (Xanax), lorazepam (Ativan), clonazepam (Klonopin) or diazepam (Valium), and muscle relaxants. Among people aged 12 and older, 2.2% (or 6.2 million people) misused tranquilizers or sedatives in the past year. Again, young adults had the highest percentage of misusers with 3.7% (or 1.2 million people).
Benzodiazepines are chemically similar regardless of whether they are prescribed as a sedative or a tranquilizer. Xanax, which is prescribed as a tranquilizer, has an average half-life of 11.2 hours (the length of time for half the dosage to be metabolized). Halcion, a benzodiazepine prescribed as a sedative, has a short half-life of between 1.5 and 5.5 hours. Research had shown that benzodiazepines with a short half-life have a greater dependency potential. Young adults once again had the highest percent of misusers 3.3% (or 1.1 million people).
Digging deeper into pain reliever misuse, the 2020 NSDUH asked respondents to identify specific pain relievers they used over the past year, and then categorized them into subtypes, such as hydrocodone or oxycodone products. Hydrocodone products such as Vicodin, Lortab, Norco, Zohydro ER and generic hydrocodone were the most commonly misused. Among people 12 and older, 1.7% (or 4.7 million people) misused them. There were 1.1% (or 3.2 million people) who misused oxycodone products such as OxyContin, Percocet, Percodan, Roxicodone and generic oxycodone.
No surprise, young adults aged 18 to 25 had the highest percentage of misuse with 4.1% (or 1.4 million people), followed by adults 26 and older with 3.4% (or 7.5 million people). A question arises at this point with regard to young adults. Given the evident pattern with young adults having the greatest potential to develop problems of misuse with stimulants, tranquilizers benzodiazepines and pain relievers, are they cautioned of this potential when they are first prescribed the medications?
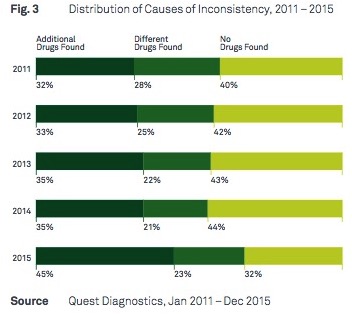
Another way of looking at pain reliever misuse noted .1% of people 12 and older misused prescription fentanyl products. This will likely underrepresent people who used and misused illicitly manufactured fentanyl (IMF) from illegal laboratories; and will not include those who used IMF mixed with heroin or sold as heroin (but only contained IMF). The following figure compares past year pain reliever misuse among people 12 and older by the selected pain reliever subtype.
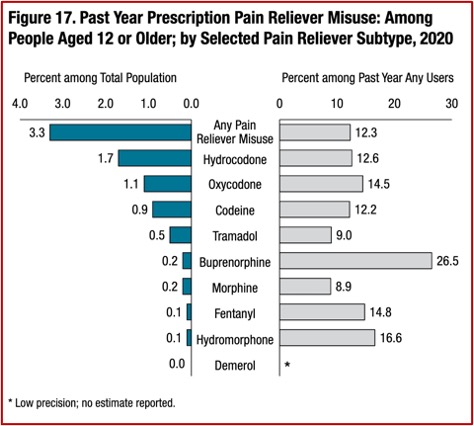
The 2020 NSDUH researchers presented the above data, and then stated that while prescription pain relievers were the second most common form of illicit drug use in 2020, “most past year users of prescription pain relievers did not misuse them in the past year.” They singled out buprenorphine, a Schedule III opioid used as an FDA approved medication for opioid misuse. Then they said the 26.5% of people who reported misusing buprenorphine over the past year meant: “Almost three fourths of past year users of buprenorphine products did not misuse them in that period.”
Another way to present this data is to say that of the .2% of people who go to a doctor for a buprenorphine prescription, supposedly to help them manage or stop their opioid misuse disorder, over 25% reported they misused their buprenorphine in the past year. There is a higher percentage of people admitting they misused buprenorphine than any of the other pain reliever subtypes.
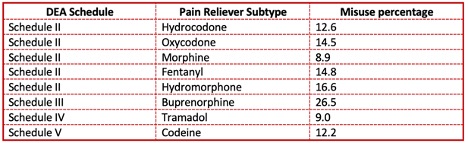
Or you can sort the pain reliever subtypes according to their DEA scheduling as controlled substances. See the chart below. Misuse with Schedule II pain relievers ranges from 8.9% with morphine to 16.6% with hydromorphone. Schedule IV or Schedule V pain relievers, codeine, at 12.2% and tramadol at 9.0% have noticeably lower misuse percentages, while buprenorphine significantly stands above them all with 26.5% misusing it. Remember it was 4th or 5th in the above noted lists of the most abused drugs in 2016 and 2017. What’s going on?
Despite buprenorphine being a Controlled Substance, it is a prescription drug used to treat opioid misuse disorder. This means it activates the same opioid receptors in the brain that the other opioid drugs above do. The effects may not be the same as with OxyContin or heroin, but it’s still an opioid. The people using buprenorphine for medication-assisted treatment (MAT) already have a history of abusing opioids. Apparently more than 25% of them can’t resist the temptation to abuse the very drug they’re supposed to be using to stop their addictive use of opioids.
Future NSDUH surveys will need to monitor this conundrum with buprenorphine, but the above review of the 2020 NSDUH revealed a concerning age-related problem with prescription drugs. There was a pattern of young adults having the highest frequency of prescription drug misuse with all categories—stimulants, pain relievers, benzodiazepines and tranquilizers. SAMHSA (Substance Abuse and Mental Health Services Administration) stated that the fastest growing drug-related problem with teenagers was prescription drugs. This has the potential to result in life-long challenges with addiction.
Our brains continue to develop until we reach our early- to mid-twenties. During adolescence, the pre-frontal cortex further develops to enable us to set priorities, formulate strategies, allocate attention, and control impulses. The outer mantle of the brain also experiences a burst of development, helping us to become more sophisticated at processing abstract information and understanding rules, laws, and codes of social conduct. Drug use impacts perception—a skill adolescent brains are actively trying to cultivate—and can fracture developing neural pathways. Additionally, as our brains are becoming hardwired during adolescence, the pathways being reinforced are the ones that stick. If those pathways include addiction, the impact may lead to life-long challenges.