02/10/17

Guns and Needles

© Roman Legoshyn | 123rf.com

Reporting for The Washington Post, Christopher Ingraham gleaned some grim facts from the recent CDC data on drug and opioid deaths in the U.S. Opioid deaths surpassed 30,000 in 2015; an increase of 5,000 from 2014. Deaths from synthetic opioids like fentanyl rose by over 70% from 2014 to 2015. For the first time since the late 1990s, heroin deaths surpassed traditional opioid painkillers like hydrocodone and oxycodone. The grimmest reality is that more people died in 2015 from heroin-related causes than gun violence. “As recently as 2007, gun homicides outnumbered heroin deaths by more than 5 to 1.”

The above linked Washington Post article graphs and discusses CDC data showing the surge in opioid deaths from 8,280 in 1999 to 33,092 in 2015. You will also find graphs of the death rate increases by three classes of opioids. And there is a graph showing the rapid increase in heroin deaths over the last five years or so to 12,989 in 2015, surpassing gun homicide deaths in 2015 by 10 (12,979).

The CDC MMWR—Morbidity and Mortality Weekly Report—indicated that the rate of drug overdose deaths increased in 30 states and DC; and remained stable in 19 others. Opioid death rates increased by 15.6% from 2014 to 2015. The report suggested the increase was most likely driven by illicitly manufactured fentanyl. These increases were also concentrated in eight states. According to another CDC MMWR from August 26, 2016, those states were: Massachusetts, Maine, New Hampshire, Ohio, Florida, Kentucky, Maryland and North Carolina.

During 2014 to 2015 death rates increased overall, as well as for both males and females in the three different classes of opioids. The following chart gives the CDC death rates by class of opioid, year, sex and overall population. The opioid classes are: natural and semi-synthetic opioids (codeine, morphine, hydrocodone, hydromorphone, oxycodone, oxymorphone and buprenorphine), synthetic opioids (meperidine and fentanyl) and heroin. Heroin is a semi-synthetic opioid, but was assessed separately by the CDC. Methadone is a synthetic opioid but was also assessed separately. See the CDC MMWR for data on methadone deaths.  The “rate” in the chart is the death rate per 100,000 people.

Characteristic

Natural and semi-synthetic opioids

2014

2015

% change in rate, 2014 to 2015

No. (rate)

No. (rate)

Overall

12,159 (3.8)

12,727 (3.9)

2.6%

Sex

Male

6,732 (4.2)

7,117 (4.4)

4.8%

Female

5,427 (3.3)

5,610 (3.4)

3.0%

Characteristic

Synthetic opioids other than methadone

2014

2015

% change in rate, 2014 to 2015

No. (rate)

No. (rate)

Overall

5,544 (1.8)

9,580 (3.1)

72.2%

Sex

Male

3,465 (2.2)

6,560 (4.2)

90.9%

Female

2,079 (1.3)

3,020 (1.9)

46.2%

Characteristic

Heroin

2014

2015

% change in rate, 2014 to 2015

No. (rate)

No. (rate)

Overall

10,574 (3.4)

12,989 (4.1)

20.6%

Sex

Male

8,160 (5.2)

9,881 (6.3)

21.2%

Female

2,414 (1.6)

3,108 (2.0)

25%

From 2014 to 2015, the combined opioid death rates increased by 15.6%. The most radical increases were with synthetic opioids, overwhelmingly from fentanyl. The overall increase was 72.2%, driven primarily by a 90.9% increase in male deaths. Overall heroin deaths in 2015 were higher than the number of deaths from natural and semi-synthetic opioids in 2015. Death rates from natural and semi-synthetic opioids increased as well, but at a more leisurely rate.

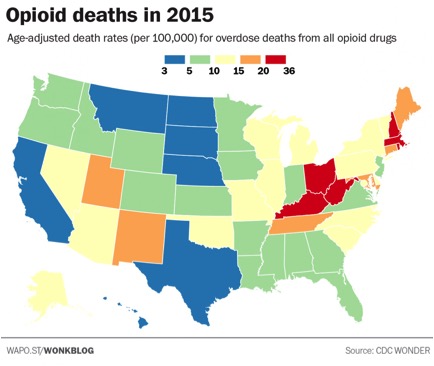
Another Washington Post article by Christopher Ingraham, “Where opiates killed the most people in 2015,” again used CDC data to compose a series of maps. These maps illustrated which states in 2016 had the most opioid deaths overall and also by classes of opioids: heroin, synthetic and natural (natural and semi-synthetic). Nationally, there were roughly 10.4 opioid overdose deaths per 100,000 people. But New England, and the Ohio/Kentucky/West Virginia had the highest rates. Ohio, West Virginia and Connecticut had the highest death rates from heroin overdoses, between 20 and 36.

Synthetic opioid deaths were primarily located along the East Coast. The national death rate from synthetic opioids is 3.1 per 100,000. In Rhode Island it’s 13.2; in Massachusetts it’s 14.4; and in New Hampshire it’s 24.1. Ohio and West Virginia weren’t far behind. Deaths from natural and semi-synthetic opioids were concentrated in West Virginia and Utah. There is also a table of raw data by state in the article.  The following map, taken from the article, is for overall opioid deaths in the U.S. for 2015.

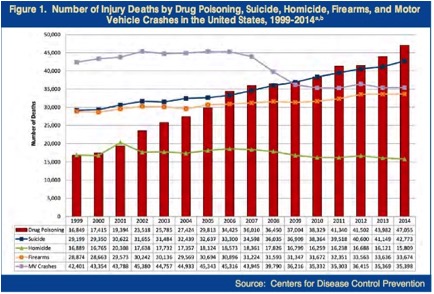
The following chart, taken from the 2016 National Drug Threat Assessment Summary, combines CDC data for deaths by drug poisoning, homicide, firearms and motor vehicle crashes between 1999 and 2014. You can clearly see how overdose deaths have risen, outpacing the other causes of death. The 2016 NDTA Summary said drug overdose deaths are at the highest level ever recorded. “In 2014, approximately 129 people died every day as a result of drug poisoning.” Since 2010, there has been a 248% increase in heroin overdose deaths.

The U.S. has seen a dramatic increase in the availability of heroin in the last ten years, allowing the heroin threat to expand exponentially.  The increases with heroin production in Mexico have guaranteed a steady supply of low-cost heroin, despite the increases in the number of users over the past decade. While heroin from four source areas (Mexico, South America, Southwest Asia, and Southeast Asia) can be found somewhere in the U.S., Mexico is the main source of heroin. South America is the second most common source. Mexican heroin accounted for 79% of the total weight of heroin analyzed by the Heroin Signature Program.

The domestic supply of Mexico-sourced heroin is more than sufficient to satisfy current U.S. market demand. Moreover, Mexican heroin traffickers are able to keep the supply steady and reliable. This is evidenced by high availability levels in U.S. heroin markets and low retail-level prices.

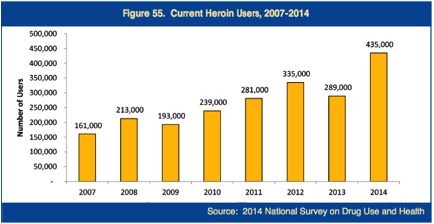
The number of individuals who used heroin in the month prior to a National Survey on Drug Use and Health (NSDUH) increased by 154% between 2007 and 2014. There was a 51% increase in just the last year of the survey; 27% reported lifetime heroin use. “The estimated number of new heroin initiates doubled between 2007 (106,000) and 2014 (212,000).” See the following graph for more information on current heroin users between 2007 and 2014 from the 2016 NDTA Summary.

So far we’ve looked at the opioid epidemic from the perspective of national statistics and surveys. But I want to close with a more up-close-and-personal look at the issue. During the summer of 2016, I read Gun, Needle, Spoon by Patrick O’Neil. Gun is a compelling look at the life of a “current heroin user.” Patrick has over fifteen years clean now, but gives you a clear-eyed, non-blinking look into the abyss of heroin addiction in his memoir. What follows are a couple of paragraphs of life in that nightmare. Read Gun, Needle, Spoon for more.

Technically, kicking heroin takes three days. Every junkie’s kick is slightly different, yet the symptoms are the same. For me it starts out with an unpleasant familiar taste in the back of my throat. My nose begins to run, I sneeze a lot, and my eyes water. Then the aches arrive, followed by vomiting and diarrhea. There’s no sleeping. I’m either cold and shivering or hot and continually sweating. My muscles cramp, my head feels thick, and all I think about is doing more dope in order to not be in such misery. . . .The digital clock on the desk in the living room read 11:55 PM. I light a cigarette and stare at the gun. Before I can really think about it, I pull on a pair of jeans and get dressed. Digging through a pile of dirty clothes, I find a black bandana and tie it loosely around my neck. I slip the gun into my waistband, button my overcoat, and quickly open the front door.

P.S. There is good new here. Patrick just wrote that he received a pardon from the governor of California for his past crimes. You can read about the day he received his pardon here. And take the time to congratulate him, will you?

08/30/16

The Devil in Ohio

© Olena Yakobchuk | 123rf.com

© Olena Yakobchuk | 123rf.com

Around the beginning of July 2016, there were a series of overdoses and deaths in Akron Ohio. The ABC News affiliate in Cleveland reported there had been 173 overdoses in Akron by July 22; 16 of which were fatal.  Some of the first people to overdose had not shot up—they were snorting what they thought was heroin. “As soon as I sniffed it, I knew something was up because it got me feeling super intense,” he said. When I woke up, I was on a stretcher. I was freaking out because I didn’t know what happened. I was tied down.”

The overdoses are being attributed to a street mixture of heroin and carfentanil, an opioid considered to be 4,000 times as potent as heroin. There were some misleading news reports at the time suggesting that heroin users themselves were mixing heroin and carfentanil (carfentanyl). Reporting for Cincinnati.com, Terry DeMio said that the Hamilton County Heroin Coalition warned carfentanil had been found in the local heroin of Cincinnati, Akron and Columbus. Dr. Marc Fishman said: “Carfentanil is one of the most potent opioids known, as an anesthetic agent by veterinarians for large animals, not used for humans.” Veterinarians who are licensed to use it cover up hands, arms and faces when they use it … and they keep naloxone handy.

Then the overdoses started happening again in the Cincinnati area. The Washington Post reported there were 78 overdoses and at least three deaths during a 48-hour period. By the end of the week, the overdose total has reached 174. Some of the overdose victims required multiple doses of naloxone to reverse the effects. Although they are still awaiting the lab results, the police believe this is another batch of heroin mixed with carfentanil. So far law enforcement has not been able to identify the source of the mixture. Newtown Police Chief Tom Synan said:

These people are intentionally putting in drugs they know can kill someone. . . . The benefit for them is if the user survives, it is such a powerful high for them, they tend to come back. … If one or two people die, they could care less. They know the supply is so big right now that if you lose some customers, in their eyes, there’s always more in line.

WKRC in Cincinnati reported thirty overdoses in the course of just one day—Tuesday August 23rd. One man overdosed while driving through an intersection. Another man overdosed at a gas station; with his child in the car. Three other people overdosed in the same house. “It was too early to tell if the spike in overdoses Tuesday night, August 23, had anything to do with carfentanil. But, it was found in several places throughout the city of Cincinnati in early August 2016.”

carfentanil molecule

carfentanil molecule

So what exactly is carfentanil? According to PubChem, carfentanil is an analog drug of fentanyl that was first synthesized in 1974 by a team of chemists working for Janssen Pharmaceuticals. It’s marketed under the trade name of Wildnil as a general anesthetic for large animals, like elephants and rhinoceros. Its extreme potency makes it an inappropriate agent for human use, unless you happen to be a Walter White-type of entrepreneur with heroin. It is classified as a Schedule II controlled substance.

A 2012 study found evidence that the Russian military used an aerosol form of carfentanil and remifentil in the 2002 Moscow theatre incident to subdue Chechen hostage takers. The Washington Post reported the death toll was 170 people; only 40 of the dead were attackers. Because of the lack of information provided to emergency workers, they didn’t bring enough naloxone or naltrexone to prevent the complications experienced by the gassed victims “from both respiratory failure and aerosol inhalation during the incident.” A 10 mg dose of carfentanil could sedate or kill a 15,000-pound elephant or take down a musk ox, bull moose or full grown buffalo. The same amount could kill 500 human beings.

Heroin cut with carfentanil offers a harder-hitting, longer-lasting high and allows dealers a shortcut to increase their supplies. But users often don’t know what they’re getting. In recent months, authorities have linked carfentanil to a spike in overdoses in several states, and have warned that it could spread to others.

On August 9, 2016 Canadian border officials reported they had intercepted a one-kilogram package of carfentanil heading to Calgary from China. The package was shipped to a 24 year-old man at his home address and labeled as “printer accessories.” A kilogram of carfentanil is equivalent to four metric tons of pure heroin. The package could have produced 50 million doses. Roslyn MacVicar of the Canadian Border Services Agency said: “It is hard to imagine what the impact could have been if even the smallest amounts of this drug were to have made its way to the street.”

In a DEA report Donald Cooper presciently thought that analogs of fentanyl would become a future drug of abuse He indicated that the already published synthesis schemes for fentanyl compounds allow for a variety of precursor chemicals to be used in synthesizing the drugs. The DEA became aware of this potentiality from the confiscated notes from an anonymous clandestine laboratory. Two formulas for synthesizing carfentanil have been extracted from separate volumes of the Journal of Organic Chemistry and made available for any enterprising chemist in “Synthesis of Carfentanil” on Erowid. The DEA indicated that over 12 different analogues of fentanyl have been clandestinely produced and identified in the U.S. drug traffic.

Interviewed by CBS News, Kevin McCutheon of Akron Ohio is a long-time addict. He believes when he overdosed he ingested carfentanil. He said he had used fentanyl and has been “doin’ dope,” but this wasn’t the same. The interviewer commented that he had tears in his eyes. He said it was because he was here and knew he shouldn’t be. “It’s the devil.”

05/17/16

Overdosing

© banerwega | stockfresh.com

© banerwega | stockfresh.com

Melanie (not her real name) was one of the first persons I counseled at White Deer Run in the late 1980s. She was 18 at the time, and a heroin addict before it was being called a national epidemic. She completed treatment; relapsed and returned about a year later as an adult patient. I think she even completed treatment that time as well. I can’t tell you much more about her, except that she was from Philly; and she is the first person I worked with who became an overdose statistic. There have been many more since then.

Most of the places I’ve worked as a drug and alcohol counselor have been within Pennsylvania. So when I heard of the study done by Balmert et al. on the accidental poisoning deaths in Pennsylvania from 1979 to 2014, I was interested in reading it. There aren’t too many ways that statistics, especially death statistics, can be interesting reading. But buried within those tables and figures are people I knew.

Within a data set attached to the study, I found the reported deaths by accidental drug poisoning for the years 1987 through 1989.  In 1987, there were 41 individuals between the ages of 15 and 24 who died from accidental poisoning, 6 of whom were female; in 1988 there were 39, 12 of whom were female; in 1989 there were 54, 9 of whom were female. Somewhere in those statistics is Melanie’s overdose.

When I compared those deaths with the last three in the data set, 2012, 2013 and 2014, the stats grew exponentially. In 2012, there were 224 individuals between the ages of 15 and 24 who died from accidental poisoning, 63 of whom were female; in 2013 there were 203, 47 of whom were female; in 2014 there were 277; 70 of whom were female.  That’s a lot of Melanie’s.

The CDC published a data brief indicating drug poisoning became the leading cause of injury-related death in 2008, surpassing deaths from motor vehicle accidents. 90% of those deaths were from drug poisoning. From 1999 to 2008 the number of drug poisoning deaths from opioid analgesics more than tripled. “Of the 36,500 drug poisoning deaths in 2008, more than 40% (14,800) involved opioid analgesics.”

Most of those 14,800 deaths involved natural and semi-synthetic opioid analgesics such as morphine, hydrocodone and oxycodone. The number of drug poisoning deaths from methadone, a synthetic opioid, increased sevenfold from 1999 to 2007. Then it decreased between 2007 and 2008. The age group with the highest death rate from opioid poisonings was between 45 and 54 years of age.

In 2007-2008 48% of Americans reported the use of at least one prescription drug in the past month. Not surprisingly, this was related to increases in drug use, misuse and nonfatal health outcomes. Over 5 million reported using prescription pain relievers nonmedically in the previous month.

In 2012 the CDC looked specifically at drug-poisoning deaths from opioid analgesics and heroin. Their report in Health E-Stats noted that from 1999 to 2012 the drug poisoning deaths from opioid analgesics increased from 1.4 per 100,000 in 1999 to 5.1 in 2012. The death rates from heroin overdoses nearly tripled from .7 per 100,000 in 1999 to 1.9 in 2012. The states with death rates significantly higher than the overall U.S. rate of 13.1 per 100,000 included Pennsylvania, Ohio and West Virginia, which had the highest overall rate at 32.0 per 100,000. See the linked CDC reports for more detailed information.

Returning to the Balmert et al. study on accidental poisoning deaths in Pennsylvania, we can see how the Pennsylvania rates compare to those just reviewed. Table 1 in Balmert et al. indicated the overall death rate for Pennsylvania in 2014 was 29.16 per 100,000. The death rate was highest for the 25-34 age group (39.87), and lowest among the 15-24 age group (16.25). See  Table 1 in the Balmert et al. article.

Examining the mortality patterns by county showed that the highest rates for males from 2010 to 2014 were in the counties of southwestern PA (the Pittsburgh metro area), the counties surrounding Philadelphia and those near Scranton in the Northeast part of the state. The highest rates for females were in the same areas.

The county level findings provide possible avenues for targeting interventions to areas with the highest mortality from accidental poisoning. Counties with the highest 2010–2014 rates in females are primarily in suburban southwest PA. In males, the highest prevalence rates are more widespread and include both southwest and southeast PA, plus the northeast area including Carbon and Susquehanna. These patterns emphasize that, currently, accidental poisoning deaths especially among white females are occurring in suburban and rural areas. Other area-specific analyses should focus on non-urban mortality patterns.

In September of 2014 legislation went into effect allowing first responders to carry naloxone for reversing the effects of an overdose. As of September 1, 2015, 302 overdoses had been reversed with naloxone. The following graphic represents the drug-related overdose deaths by county in Pennsylvania for 2014. See the original here.

Untitled

In September of 2015, Tom Wolf, the governor of Pennsylvania, announced that the CDC had granted the Pennsylvania Department of Health $900,000 to prevent overdose deaths related to prescription opioids. Governor Wolf said: “Too many citizens of our commonwealth are dying from drug overdose, and Pennsylvania families in hardworking communities are impacted by prescription drug addiction every day.” The “Prevention for States” grant will support 16 states with annual awards between $750,000 and $1 million over the next four years. The goal is to hopefully turn the tide on the prescription drug overdose epidemic by implementing prevention strategies and improving safe prescribing practices.

On March 18, 2016, the CDC published revised guidelines for primary care physicians when prescribing pain medication. Nearly half of all opioid prescriptions are dispensed by primary care clinicians. An estimated 20% of patients with noncancer pain symptoms or pain-related diagnoses receive an opioid prescription. While evidence supports the short-term efficacy of opioids for reducing pain, few studies have assessed the long-term benefits of opioids for chronic pain. An estimated 9.6 to 11.5 million adults (3% to 4% of the adult U.S. population) were prescribed long-term opioid therapy in 2005.

This guideline is intended to improve communication between clinicians and patients about the risks and benefits of opioid therapy for chronic pain, improve the safety and effectiveness of pain treatment, and reduce the risks associated with long-term opioid therapy, including opioid use disorder, overdose, and death.

The guidelines are not mandatory, but if they are followed, maybe the opioid-related overdose deaths will start to decrease and people like Melanie will live instead of die.