Reporting for The Washington Post, Christopher Ingraham gleaned some grim facts from the recent CDC data on drug and opioid deaths in the U.S. Opioid deaths surpassed 30,000 in 2015; an increase of 5,000 from 2014. Deaths from synthetic opioids like fentanyl rose by over 70% from 2014 to 2015. For the first time since the late 1990s, heroin deaths surpassed traditional opioid painkillers like hydrocodone and oxycodone. The grimmest reality is that more people died in 2015 from heroin-related causes than gun violence. “As recently as 2007, gun homicides outnumbered heroin deaths by more than 5 to 1.”
The above linked Washington Post article graphs and discusses CDC data showing the surge in opioid deaths from 8,280 in 1999 to 33,092 in 2015. You will also find graphs of the death rate increases by three classes of opioids. And there is a graph showing the rapid increase in heroin deaths over the last five years or so to 12,989 in 2015, surpassing gun homicide deaths in 2015 by 10 (12,979).
The CDC MMWR—Morbidity and Mortality Weekly Report—indicated that the rate of drug overdose deaths increased in 30 states and DC; and remained stable in 19 others. Opioid death rates increased by 15.6% from 2014 to 2015. The report suggested the increase was most likely driven by illicitly manufactured fentanyl. These increases were also concentrated in eight states. According to another CDC MMWR from August 26, 2016, those states were: Massachusetts, Maine, New Hampshire, Ohio, Florida, Kentucky, Maryland and North Carolina.
During 2014 to 2015 death rates increased overall, as well as for both males and females in the three different classes of opioids. The following chart gives the CDC death rates by class of opioid, year, sex and overall population. The opioid classes are: natural and semi-synthetic opioids (codeine, morphine, hydrocodone, hydromorphone, oxycodone, oxymorphone and buprenorphine), synthetic opioids (meperidine and fentanyl) and heroin. Heroin is a semi-synthetic opioid, but was assessed separately by the CDC. Methadone is a synthetic opioid but was also assessed separately. See the CDC MMWR for data on methadone deaths. The “rate” in the chart is the death rate per 100,000 people.
|
Characteristic |
Natural and semi-synthetic opioids |
||
|
2014 |
2015 |
% change in rate, 2014 to 2015 |
|
|
No. (rate) |
No. (rate) |
||
|
Overall |
12,159 (3.8) |
12,727 (3.9) |
2.6% |
|
Sex |
|||
|
Male |
6,732 (4.2) |
7,117 (4.4) |
4.8% |
|
Female |
5,427 (3.3) |
5,610 (3.4) |
3.0% |
|
Characteristic |
Synthetic opioids other than methadone |
||
|
2014 |
2015 |
% change in rate, 2014 to 2015 |
|
|
No. (rate) |
No. (rate) |
||
|
Overall |
5,544 (1.8) |
9,580 (3.1) |
72.2% |
|
Sex |
|||
|
Male |
3,465 (2.2) |
6,560 (4.2) |
90.9% |
|
Female |
2,079 (1.3) |
3,020 (1.9) |
46.2% |
|
Characteristic |
Heroin |
||
|
2014 |
2015 |
% change in rate, 2014 to 2015 |
|
|
No. (rate) |
No. (rate) |
||
|
Overall |
10,574 (3.4) |
12,989 (4.1) |
20.6% |
|
Sex |
|||
|
Male |
8,160 (5.2) |
9,881 (6.3) |
21.2% |
|
Female |
2,414 (1.6) |
3,108 (2.0) |
25% |
From 2014 to 2015, the combined opioid death rates increased by 15.6%. The most radical increases were with synthetic opioids, overwhelmingly from fentanyl. The overall increase was 72.2%, driven primarily by a 90.9% increase in male deaths. Overall heroin deaths in 2015 were higher than the number of deaths from natural and semi-synthetic opioids in 2015. Death rates from natural and semi-synthetic opioids increased as well, but at a more leisurely rate.
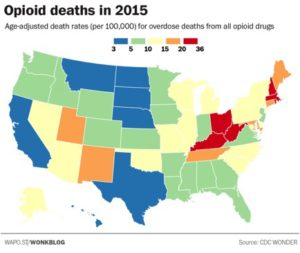
Another Washington Post article by Christopher Ingraham, “Where opiates killed the most people in 2015,” again used CDC data to compose a series of maps. These maps illustrated which states in 2016 had the most opioid deaths overall and also by classes of opioids: heroin, synthetic and natural (natural and semi-synthetic). Nationally, there were roughly 10.4 opioid overdose deaths per 100,000 people. But New England, and the Ohio/Kentucky/West Virginia had the highest rates. Ohio, West Virginia and Connecticut had the highest death rates from heroin overdoses, between 20 and 36.
Synthetic opioid deaths were primarily located along the East Coast. The national death rate from synthetic opioids is 3.1 per 100,000. In Rhode Island it’s 13.2; in Massachusetts it’s 14.4; and in New Hampshire it’s 24.1. Ohio and West Virginia weren’t far behind. Deaths from natural and semi-synthetic opioids were concentrated in West Virginia and Utah. There is also a table of raw data by state in the article. The following map, taken from the article, is for overall opioid deaths in the U.S. for 2015.
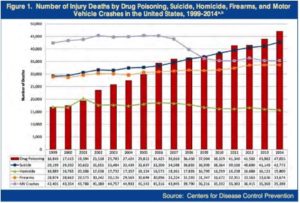
The following chart, taken from the 2016 National Drug Threat Assessment Summary, combines CDC data for deaths by drug poisoning, homicide, firearms and motor vehicle crashes between 1999 and 2014. You can clearly see how overdose deaths have risen, outpacing the other causes of death. The 2016 NDTA Summary said drug overdose deaths are at the highest level ever recorded. “In 2014, approximately 129 people died every day as a result of drug poisoning.” Since 2010, there has been a 248% increase in heroin overdose deaths.
 The U.S. has seen a dramatic increase in the availability of heroin in the last ten years, allowing the heroin threat to expand exponentially. The increases with heroin production in Mexico have guaranteed a steady supply of low-cost heroin, despite the increases in the number of users over the past decade. While heroin from four source areas (Mexico, South America, Southwest Asia, and Southeast Asia) can be found somewhere in the U.S., Mexico is the main source of heroin. South America is the second most common source. Mexican heroin accounted for 79% of the total weight of heroin analyzed by the Heroin Signature Program.
The domestic supply of Mexico-sourced heroin is more than sufficient to satisfy current U.S. market demand. Moreover, Mexican heroin traffickers are able to keep the supply steady and reliable. This is evidenced by high availability levels in U.S. heroin markets and low retail-level prices.
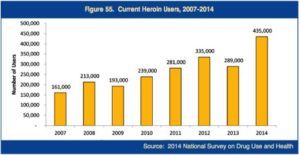
The number of individuals who used heroin in the month prior to a National Survey on Drug Use and Health (NSDUH) increased by 154% between 2007 and 2014. There was a 51% increase in just the last year of the survey; 27% reported lifetime heroin use. “The estimated number of new heroin initiates doubled between 2007 (106,000) and 2014 (212,000).” See the following graph for more information on current heroin users between 2007 and 2014 from the 2016 NDTA Summary.
 So far we’ve looked at the opioid epidemic from the perspective of national statistics and surveys. But I want to close with a more up-close-and-personal look at the issue. During the summer of 2016, I read Gun, Needle, Spoon by Patrick O’Neil. Gun is a compelling look at the life of a “current heroin user.” Patrick has over fifteen years clean now, but gives you a clear-eyed, non-blinking look into the abyss of heroin addiction in his memoir. What follows are a couple of paragraphs of life in that nightmare. Read Gun, Needle, Spoon for more.
Technically, kicking heroin takes three days. Every junkie’s kick is slightly different, yet the symptoms are the same. For me it starts out with an unpleasant familiar taste in the back of my throat. My nose begins to run, I sneeze a lot, and my eyes water. Then the aches arrive, followed by vomiting and diarrhea. There’s no sleeping. I’m either cold and shivering or hot and continually sweating. My muscles cramp, my head feels thick, and all I think about is doing more dope in order to not be in such misery. . . .The digital clock on the desk in the living room read 11:55 PM. I light a cigarette and stare at the gun. Before I can really think about it, I pull on a pair of jeans and get dressed. Digging through a pile of dirty clothes, I find a black bandana and tie it loosely around my neck. I slip the gun into my waistband, button my overcoat, and quickly open the front door.
P.S. There is good new here. Patrick just wrote that he received a pardon from the governor of California for his past crimes. You can read about the day he received his pardon here. And take the time to congratulate him, will you?


